Azure Log Analytics | CPU Performance Monitor
In this article we will create a CPU Performance monitor View for our servers at the Azure Log Analytics (OMS) Portal.

At the Microsoft Operations Management Suite (OMS) portal press the + button to create a new View

The View Designer workspace will open. Select the “Line chart & callout”

At the Properties blade enter a Name, something like “CPU Performance Monitor”, add the below query and press Apply
Type:Perf CounterName="% Processor Time" InstanceName="_Total" | measure avg(CounterValue) by Computer Interval 10Minutes

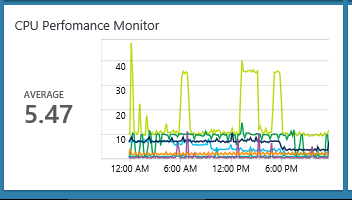
Pressing Apply you will see at the Preview window the “Name” and the CPU Performance of all the Windows servers that are monitored by OMS agent.

The next step is to press the “+ View” tab and add a “Stack of line charts

The “Stack of line charts” will add three charts per row and we can use it to add our servers. We will create something like that:

So, at the Properties blade add a name and a query for each server needs to be monitored and press Apply. For more than three servers add more “Stack of line charts”.
The query is the below, just change the Computer = “server.domain.local” with your servers.
Type:Perf CounterName="% Processor Time" InstanceName="_Total" AND Computer = "server.domain.local" | measure Avg(CounterValue) as 'CPU_Percentage' by Computer Interval 10Minutes

Finally press “Save” at the View Designer

The result is a CPU Performance monitor for all servers at the OMS Portal.

And when you press it you have the CPU Performance Monitor of all added servers.

Stay tuned for the next part

Pantelis Apostolidis is a Cloud Solutions Architect at Microsoft and an ex Microsoft Azure MVP. For the last 15 years, Pantelis has been involved to major cloud projects in Greece and abroad, helping companies to adopt and deploy cloud technologies, driving business value. He is entitled to a lot of Microsoft Expert Certifications, demonstrating his proven experience in delivering high quality solutions. He is an author, blogger and he is acting as a spokesperson for conferences, workshops and webinars. He is also an active member of several communities as a moderator in azureheads.gr and autoexec.gr. Follow him on Twitter @papostolidis.
